

Beware the Lies you Read. Beware the Market Mania.

I want to comment on an article featured prominently all weekend on Zero Hedge because it is packed full of so many lies or distortions that I don’t know what it was even doing there. As you know, I read Zero Hedge a lot and appreciate economic perspectives they give, so I’ll give them the benefit of the doubt and hope the article was featured so prominently just to annoy people like me who don’t like lies, fake news and fantasy investing in order to get someone to take the author on and dispute his claims. Perhaps it was posted as a prime example of bullheaded market mania for everyone to see just how bad it is.
That article was oddly titled, “Rear View Mirror: Sideways Earnings = Sideways Price. Windshield View?” O.K. Whatever. I should have known better than to read an article with a title like that as the title alone ties my head in a knot, so it’s no wonder the article’s arguments shorted all the circuits in my brain.
The most blatant lie found in this article is the author’s statement that the S&P hasn’t performed as well in the past 19 years as in all previous years. According to the author, if the S&P merely reverted to its mean, it would be higher today than it is. I about fell over dead.
First, let’s start with a non-logarithmic chart that just shows point gain … just for fun. There you’ll see the S&P enjoyed the steepest point rise in the history of stocks:

Seriously? How can anyone try to make the argument that the S&P;s rise of late has been subpar with a straight face? Even if you start back 19 years at the peak of the dot-com bust where the author chooses to start, you’d have a steeper incline than in all previous years; but looking at where it has gone since the end of the Great Recession … it’s gone insane. The author must smile like the twisted Grinch when he says these things, and he must be consuming a lot of crack.
Switch to a logarithmic chart (showing percentage gains, instead of raw point gains) to keep everyone happy, and it makes all the difference in the world where you choose your starting points:

If you start from the very beginning of the S&P 500 in the chart data available from MarketWatch, the present slope is almost an exact resumption of everything that went before. Cut out the two insane bubbles the Fed manufactured — the run-up to the dot-com bust and the housing bubble — and compare the S&P prior to that Fed insanity with the S&P after that insanity, and the S&P rise after those bubbliciuous periods is actually slightly steeper than its rise before. (And it’s reasonable to factor that nonsense out because everyone knows those bubbles were insanity that the market could never hold and that should never have happened. They were historic aberrations.) There is, however, nothing to say the market needs to finish catching up to where it would have been if each of those two anomalies hadn’t broken disastrously.
The author’s idea that the 2/10 yield curve on treasuries has to invert before a recession is unproven, though a lot of people fixate on it. He says, because that particular inversion hasn’t happened yet, the clock has not even started for an economic downturn. However, the 3M-over-10Y yield curve on treasury interest is the Fed’s chosen gauge for assessing when recessions are looming, and the market has just as reliably fallen after that inversion as after the 2s over 10s. The 2s over 10s typically invert along with the 3M over 10Ys, but there is nothing to say they have to. The 3M-over-10Y curve has been inverted now for months, meaning the clock started months ago, and a recession could begin as early as this summer.
The author notes the fear-greed index is neutral right now, and it is supposed to be in the extreme greed zone for the market to crash. I’ll note that this unreliable index has bounced back and forth between all-out fear and all-out greed several times in recent years with no recession and no stock market crash, so which time is the one that is supposed to count? I’ve seen it go from one extreme to the other in less than two months, maybe even a month — once with a crash, other times without any event. It’s just sentimental.
The influence of this gauge seems largely based on Sir John Templeton’s theorem that markets rise on panic and fall on enthusiasm. So, the market needs to become irrationally exuberant in order to crash. I believe that aphorism, but there is widespread misunderstanding about how it works.
The narrow truth is that markets only panic in an evironment of fear. Panic doesn’t come out of nowhere. A panic isn’t likely to ensue right now unless the Fed doesn’t lower interest at the end of the month or some other black-swan event taps into the deeply growing fear that is swelling up underneath the market. However, that trigger can happen as soon as the end of this month!
Panics can develop quickly, as happened in December when a generally down-traveling and clearly fearful market came near to panicking and fell off a short cliff. Where market bulls make a huge mistake that actually sets up crashes is in taking the adage that markets fall on euphoria too far. It’s true that euphoria almost always happens in the run-up to a crash because euphoria causes the market to bid up to perilous heights that are unsustainable because they don’t have solid economic fundamentals under them. They’re just a speculator’s sugar high.
That action we’ve already seen! This is where permabulls stun me with their blind ignorance! We’ve had two of the steepest market climbs in history back to back, with the last one (the post-2018-crash rally) happening even as earnings were declining. So, how irrationally exuberant was the last six months?
Moreover, we’ve seen the market for a year now pricing in a quick resolution to the trade war, which has been like a mirage and moved forward every time we get to where it is supposed to happen. So, how irrational is it that the market today still continues to believe that nonsense? It’s TOTALLY irrational. Pure fantasy.
But the bulls can’t see it, which is really just proof of how irrational they are right now. We have a year of Lucy pulling the football away from the Charlie-Brown bulls, and they’re still falling for it! Every time Trump says, “We’re almost there. A trade deal could happen quickly now,” the bulls go for it! Because it is what they emotionally want to believe. And every time, they wind up on their butts again with no trade deal, but Trump quickly entices them to take another run at the ball, and so they do. Here we go again this week!
They’re intentional blindness and all-out stupidity knows no bounds. It’s been a year, and their irrational exuberance is running as strong as ever. A few years from now, people looking back at all this will be amazed at how the bulls couldn’t see it even with articles like this one pointing it all out to them! They’ll be amazed at how the bulls kept trying to run back up the cliff they just fell off of only to fall back down it again.
Maybe that blindness is because most of the market is operated by computers that have no rational or economic sense. They are computer algorithms programmed to do what the bulls want them to do. They are, in other words, only as rational as their programmers were, who were largely Gen-Xers and millennials who have no idea what a normal economy is anyway because they were robbed of all of that.
If there are any humans making market decisions right now, where the bulls go wrong, like the author I’m discussing, is thinking that when euphoria turns to worry, the market can’t crash because it has to be euphoric for a crash.
Wrong. The market always turns to worry before a crash. Panics happen when investors have begun to seriously worry at a deep, stomach-trembling level about where euphoria carried them. Then all the suckers that run up that perilous road get hit by a bad event that taps into their building psyche of worry about where they’ve gone, and that triggers a panic.
Without the growing wall of worry there isn’t any fear in the market to tap into. The market has to be developing some deep fears (just as in any human panic situation) for something to be able to suddenly trigger a landslide of horror. Horror doesn’t come out of nowhere. Look at how horror films slowly build up the anticipation of something going bad before they shock you into panic.
Bulls set their own traps when they believe markets don’t collapse in an environment of fear. Take an environment of suppressed but growing fear beneath the surface and then give it something that suddenly says those growing fears are well-founded, and you have horror. We saw that kind of fear churning in the final run-up of the dot-com bust and in the days just before Black Tuesday in 1929 where the market kept surging upward as fear was building beneath the surface.
“EPS will beat and come in slightly positive yoy.”
That is, at best, a wildly optimistic guess. Many commentators have been saying that EPS is already looking likely to disappoint. Even the overly rosy, practically permabull Jim Cramer has said he knows of NO COMPANY among his many contacts with anything good to report from the season just past about its earnings per share. All the CEOs he talks with are expecting earnings to be down. If Crazy Cramer can’t find a single optimistic CEO, then where does this author come up with his nonsense?
“Guidance will be less pessimistic with the tariff increases on hold.”
It probably will, but right now guidance has been very pessimistic, so “less pessimistic” is still pessimistic! Not a lot of room to run on that one.
“The Fed is still in a position – with slower growth and the lagged impact of tightening too quickly in 2018 – that they have plenty of cover to start cuts at the July meeting.“
O.K. now. That one is a bit twisted. The lag-time for the Fed has nothing to do with the stock market, and the author is supposedly writing about stocks. It is lag-time for any move on interest or money supply by the Fed to effect the general economy — two different things, especially when the stock market has become so unhinged from the economy that it isn’t paying any attention to the economy anyway. (The stock market has often responded to mere announcements of the Fed’s intended moves, so the market has often responded even before the Fed’s move happened. There is no lag between the Fed’s actions and the market’s response.)Â
What lag time means when people are talking about Fed actions is that the Fed’s tightening takes, at least, six months to start to have any effect on the general economy (i.e. on GDP). As a result, we won’t see the effects of interest and money-supply tightening that happened in December begin to play through until June or July. Moreover, money-supply tightening continued at the same rate for all of the past months until June and still continues at a slower pace, and none of that has started to play through.
What that actually means is that there is a lot of economic bad news that is just starting to show up and that will likely get worse and worse for the next six months. Now, the author may be right that this will cause the Fed to return to easing at the end of the month, but he misses the point, which is that it means the easing will come too late to do the economy any good. However, how that affects a market that is completely unhinged from economic reality remains to be seen.
Here is a chart that shows how effective Fed rate cuts are for slowing down an economic decline and a stock-market collapse that has already begun:
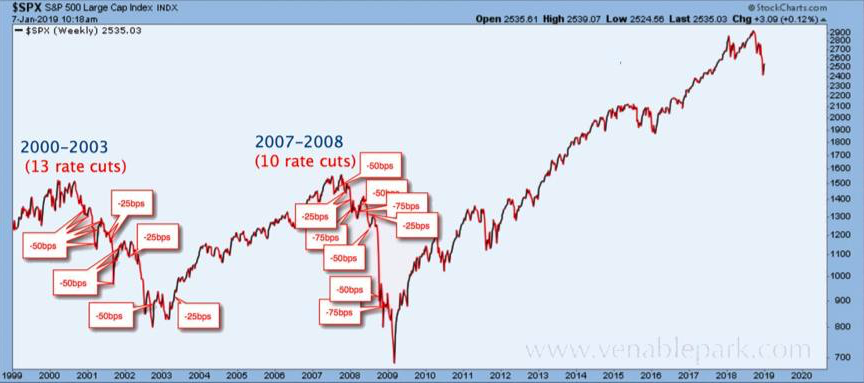
O.K. So, going back two recessions, it took 13 rate cuts over the course of three years to stop the market’s fall and the recessionary downturn. Going back to the last recession, it took ten rate cuts over the course of two years. So, don’t get too exited that the Fed’s first rate cut, if it happens as everyone is betting at the end of July, is the beginning of good news for either the stock market or the general economy!
It certainly hasn’t ever been in the past. I’ve pointed out many times now how the Fed’s first target interest-rate cut is typically the final trigger that comes right before a recession. (Maybe not so much a trigger as it is that the Fed never starts loosening rates until signs of a recession are already evident, which is usually the case because a recession is already here but just hasn’t been officially declared yet!)
So, if you get a high off of the rate-cut news, you’re sniffing glue or gasoline because the Fed’s first rate cut after a period of tightening, has NEVER been good news for either the economy or the stock market. It only happens because everything is falling apart like a car rolling end-over-end downhill.
“Forward guidance is still strong: For Q4 2019, analysts are projecting earnings growth of 6.3%. For Q1 2020, analysts are projecting earnings growth of 9.9%. For Q2 2020, analysts are projecting earnings growth of 12.9%”
This hedgehog author is obviously reading very different analysts than I am because, I’ve heard an awful lot of negative forward guidance this year. I mean A LOT! During the reporting for the first quarter almost all forward guidance was, not just bad but abysmal. The only salvation for the market was that it was so abysmal that corporations managed to beat it … though not by much. For the euphoric stock market, that was good enough. So, it turns my mind into a pretzel to even try to guess how this hedge-fund author gets “strong” forward guidance out of anything written of late.
I do note, however, that he has to reach out to next year to find that positive guidance, and people who are negative about the present year can find more room to be positive about the next one, such as by believing surely tariffs will end by then, releasing a huge pent-up amount of business.
There is a LOT of blue sky in “next year.” First of all, such guidance doesn’t help either the economy or the market in the next six months of this year. Second, we actually have no idea when tariffs will end. If you still believe the lie that it will be soon, then you are someone who fails to learn from history because we’ve been told that lie every month for a year now, and we are not one bit closer now than a year ago. Third, all the wreckage from the Fed’s last six months of tightening (and remaining three) has yet to start to play through the economy, and guidance for EPS is actually based on the economy and what businesses are doing; so, the economy is likely to deteriorate and bring EPS down over time. Fourth, the other way to get EPS up is to reduce the number of outstanding shares through stock buybacks, but buybacks seem to be slowly subsiding, as I said would happen this year due to repatriated profits slowly getting used up. So, six months from now, there may not be much buyback boost left.
Next year will be a whole different world, and from what I’ve seen neither analysts nor corporate executives have had much of a track record predicting “next year” anyway. The damage that plays through from all the Fed’s tightening this year and its December interest-rate increase may make those sugar-plum dreams about next year turn into raisins by the time next year gets here.
“A typical late cycle multiple reaches high teens to low 20’s before the blowoff. We are at 16.6x forward as of Friday’s close.“
That one appears to be pure smoke-and-mirrors deception to me. The author is blowing smoke up your donkey. Here is where we actually stand currently (not based on fictitious “forward” guidance):

At 22.01 currently and with forward guidance having trended down over the past six months (and with upward-trending guidance for next year being meaningless smoke rings), I don’t think the market is looking so low-priced as the author tries to present. Sure it is below the blow-off summits that it hit at the last two enormous bubbles, but it is still at the very top of its typical range.
What year did he write this in? Or is it just a bald-face lie? What it is is a fantasy based on future make-believe. The valuation that matters is where we are right now, and at valuation multiples for the S&P that are 22 times! earnings, we are already in the author’s own stated “blowoff” top range, meaning the top can go ahead and blow off at any minute. Where he thinks we’re going to wind up based on forward guidance a year from now is entirely meaningless if the top blows off now because we’re already there! How does he live with himself when he’s creating deception that can be so readily checked out. Answer: all the bulls are doing it. He’s just part of the pack.
Adjusted for inflation and averaged (the CAPE ratio), things look much worse:

There is only one time that the CAPE measure of P/E ratios has ever been higher than it was between December and right now, and that is the notorious dot-com bust. Right now we are exactly where we were when the market blew its top in 1929, so don’t get all bubblicious on me.
Thus, I call baloney on the author’s “forward guidance.” Recent historic guidance says we are falling hard and fast, and I haven’t read anyone who is predicting the quarter just ended will turn out to be better.
As for the author’s dream that millennials are about to drive up housing, PLEASE get on script. First, he admits that millennials are forming households later. In fact, so much later that I’d argue the formation hasn’t started yet. He’s just dreaming that it will. There have been numerous articles of late saying it may not start at all because millennials are content to live with much smaller houses and to rent, not buy. They’re content to live with small apartments because they favor spending their money on experiences, not things.
So, there is a lot of blue sky everywhere this author is looking, and that’s what bullheaded euphoria is made of. The amazing thing is how the bulls cannot see it, even as they are creating it. Let them be lemmings.


Leave a Reply